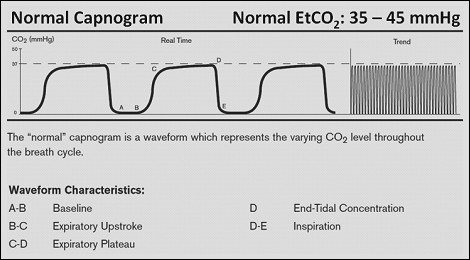
Capnogram
A capnograph provides a picture of the patients cardio-respiratory system in the form of the CO2 waveform which provides clinicians invaluable information. Viewing a numerical End Tidal CO2 value without the waveform is analogous to viewing the heart rate without the ECG trace.
During inspiration, CO2 is essentially zero and thus inspiration is displayed at the zero baseline. Phase 1 occurs as exhalation begins, which is shown as A to B on the capnogram. The first gas to appear at the sampling point is the last gas that was inhaled into the conducting airways. This gas has not been subjected to gas exchange and thus is essentially free of carbon dioxide and remains at the zero baseline.
Phase 2 is characterized by a rapid rise in CO2 concentration as anatomical dead space is replaced with alveolar gas, leading to Phase III. This is show from B to C on the capnogram.
In phase 3 (C to D on the capnogram), all of the gas passing by the CO2 sensor is alveolar gas which causes the capnograph to flatten out. This is often called the Alveolar Plateau. The End Tidal CO2 value displayed on the monitor is considered the value taken at end exhalation.
Phase four is inspiration and marked by a rapid downward direction of the capnograph (D to E). This downward stroke corresponds to the fresh gas which is essentially free of carbon dioxide that passes the sensor during inspiration, except during occurrences of rebreathing. The capnograph will then remain at zero baseline throughout inspiration.

